Choose an item from the menu on the left to go the manual chapter.
Getting Started:
Click here for a crash course to get aquainted with the program.
Introduction
XLPlot is the eXtra-Light version of the freeware program Serf Software Suite, a suite of programs that is specifically meant for biologists and can be found on the web as well. The primary purpose of XLPlot is to create a figure for scientific publication rapidly. It contains a few basic statistical functions, such as Students t-test and linear correlation of two sets of data (two columns in a spreadsheet). XLPlot has a number of build-in functions that can be fitted to the data in columns on a spreadsheet or to a curve in a graph. The user can easily add fitting functions of his own design. * Windows showing vector drawings (drawing sheets).* Windows showing columns of numerical data (spreadsheets).
Items in the latter two types of window may communicate such that a modification in a column in a spreadsheet results in a change in the associated graph. By using copy and paste functions from the menu, data from the input window may be copied to a spreadsheet or to a drawing sheet resulting in a column of numbers or a graph respectively.
Once the data on a spreadsheet have been created, a graph can be made by selecting several columns and issuing the Modify/Stats>Line plot, Modify/Stats>Wind rose plot or Modify/Stats>Bar plot command from the menu.
What the program is NOT:
Although the program contains a spreadsheet, it is NOT another copy of Excel. The underlying philosophy of XLPlot is to create and manipulate graphs and figures NOT columns of data. Because the graphs are the data, there is usually no reason whatsoever to save the spreadsheet on disk. In future versions of the program the possibility to save the spreadsheet may be even eliminated althogether. The columns of numbers that gave rise to a graph can be restored any time for manipulation anyway. Then why save the spreadsheet?
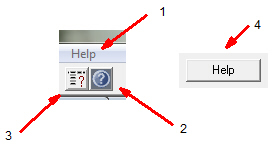
How to use this manual, 4 ways to get help
Select an item from the menu on the left to go to one of the chapters. You may also get here from your program: Select Main index from the Help menu (1). To get help on one of the main window types, activate one of the windows in your program by clicking on it and then push the help iconTo go rapidly to a section in the manual dealing with a particular menu item or button (icon) in one of the tool bars, click the
Recently a 5th way to find help is by using the menu item Help>Search the manual. This option is still in its beta phase.
In this manual, Italic text refers to a menu or to menu items.

Search the manual with google
Acknowledgements
Thanks are due to those who have stimulated the development of this program with their useful comments.
I'd like to thank in particular Joseph Skopp at the University of Nebraska who sent me his error function routine.
This program contains the sixth public release of the Independent JPEG Group's free JPEG software. This software is the work of Tom Lane, Philip Gladstone, Luis Ortiz, Jim Boucher, Lee Crocker, Julian Minguillon, George Phillips, Davide Rossi, Ge' Weijers, and other members of the Independent JPEG Group.IJG is not affiliated with the official ISO JPEG standards committee.
Compressed Tiff files are converted to Jpeg using the freeware program tiff2jpeg.