The Sound menu
Wave generator.
The wave generator sends a wave or a random signal to the soundcard as long as the dialogue box shown underneath stays up
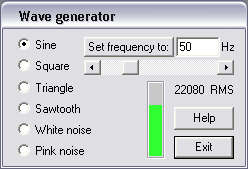
The frequency (in Hz) of the sine-, square-, triangle- or saw tooth-wave may be set either by typing a number between 10 and 20.000 in the edit box![]() and pushing the "set frequency" button or by moving the cursor in the slide bar
and pushing the "set frequency" button or by moving the cursor in the slide bar![]() . White noise is a random signal that has a flat frequency spectrum (i.e. all frequencies have the same amplitude) and a Gaussian probability density distribution. Pink noise is a random signal that has a power spectrum for which each frequency component is proportional to 1/f. It also has a Gaussian probability density distribution.
The (green) level indicator shows the RMS value of the signal at the input of the sound card in arbitrary units. It flashes red if the input clips. It is thus possible to create a (sine) frequency vs response curve by hand.
. White noise is a random signal that has a flat frequency spectrum (i.e. all frequencies have the same amplitude) and a Gaussian probability density distribution. Pink noise is a random signal that has a power spectrum for which each frequency component is proportional to 1/f. It also has a Gaussian probability density distribution.
The (green) level indicator shows the RMS value of the signal at the input of the sound card in arbitrary units. It flashes red if the input clips. It is thus possible to create a (sine) frequency vs response curve by hand.
The impulse response and the sound convolution template.
The linear properties of a system are entirely defined by the impulse response (IR) of the system. The system in question may be a biological object such as a group of neurones or a fibre responding to sensory input or it may be a mechanical system such as a loudspeaker reproducing music in a room. The latter system will be used as an example to clarify Soundss sound template-associated functions.
When playing sound through a loudspeaker box in a room, the sound is altered by the speaker box, because its frequency response may not be flat. There may be dips at the cross-over frequencies of the filters separating tweeters, mid-tone speaker and bass. The two speaker boxes reproducing stereo sound may not have identical phase spectra, making it difficult for the listener to locate the (virtual) position of the original sound source. Moreover, the room adds reverberations and echoes to the sound.
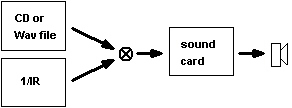
The speaker imperfections and the room reverberations may be compensated for by convolving ![]() the sound with the inverse of the system impulse response (1/IR) before playing it via the sound card. Soundss Convolve and play (on-line) and Convolve and save (off-line) functions are made for that purpose.
the sound with the inverse of the system impulse response (1/IR) before playing it via the sound card. Soundss Convolve and play (on-line) and Convolve and save (off-line) functions are made for that purpose.
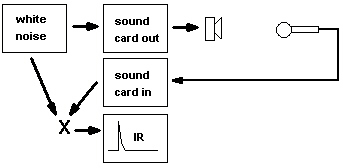
The IR of the system can be determined by presenting white noise at the input, recording the response at the output (with a calibrated microphone) and cross correlating the in- and out-put signals. Use either the On-line noise correlation option or create a white noise record (file 1) with Create>White or pink noise record, record the loudspeaker response to file 1 via a microphone using the Create>synchronous rec/play menu item, thus creating file 2. Then cross correlation (X) of files 1 and 2 using Create>cross correlation from the sound menu gives the system IR.
Edit sound template
A sound template is a graph that has a single curve, a number of data points that is a power of 2 and that has been declared by the Sound>Set as sound template command. A sound template (in this document also called impulse response) can be used to convolve audio data in a wav file or the sound card "line-in" input in order to filter, phase-shift, eliminate/add echoes or otherwise modify sound data. Upon selection of the Edit sound template command, a new temporary drawing sheet containing the sound template, its amplitude spectrum and its phase spectrum along with the dialogue window below appear.
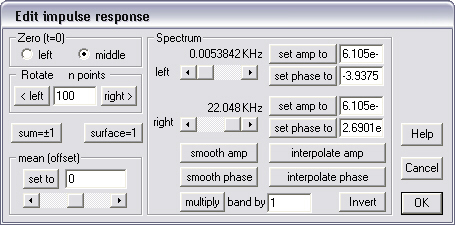
The left panel pertains to the sound template itself, while the right panel deals with its two (amplitude and phase) spectra. "Zero (t=0)" affects only the way the sound template (impulse response, IR) is presented on the drawing sheet, it has no effect on the spectra. Choose "middle" to have the IR centred.
With the left ![]() and right
and right ![]() buttons, the IR can be moved to the left or the right. Actually, the data points are rotated. The points that shift out at one extremity of the graph will be put back at the other, thus information will not be lost. This option is useful to remove a constant delay from the IR, such as the time for sound emitted by a source to reach a microphone.
The "sum=±1" and the "surface=1" buttons may be used to scale the IR to a size that will probably not lead to clipping of the output to the sound card. With "surface=1", the IR is scaled such that the surface under the IR equals one. With "sum=±1" the IR is scaled such that the absolute value of the integral of the IR equals one. This option works only if the integral is not equal to zero and it is therefore dependent of the next option.
With "mean" the mean value or offset of the IR can be set either by using the edit box
buttons, the IR can be moved to the left or the right. Actually, the data points are rotated. The points that shift out at one extremity of the graph will be put back at the other, thus information will not be lost. This option is useful to remove a constant delay from the IR, such as the time for sound emitted by a source to reach a microphone.
The "sum=±1" and the "surface=1" buttons may be used to scale the IR to a size that will probably not lead to clipping of the output to the sound card. With "surface=1", the IR is scaled such that the surface under the IR equals one. With "sum=±1" the IR is scaled such that the absolute value of the integral of the IR equals one. This option works only if the integral is not equal to zero and it is therefore dependent of the next option.
With "mean" the mean value or offset of the IR can be set either by using the edit box![]() , followed by pushing the "set to" button or by moving the cursor in the slide bar
, followed by pushing the "set to" button or by moving the cursor in the slide bar![]() . If the mean is zero, the integral of the IR will be very close to zero and pushing the "sum=±1" button will give an almost random result.
. If the mean is zero, the integral of the IR will be very close to zero and pushing the "sum=±1" button will give an almost random result.
Two red vertical lines are drawn in each of the two spectra to the right of the IR, delimiting the window of action. The left delimiter can be moved by the upper slide bar![]() in the dialogue box and the right delimiter by the lower slide bar
in the dialogue box and the right delimiter by the lower slide bar![]() . With the "set amp to" and the "set phase to" the amplitude and the phase (between –180 and +180 deg) at the current left or right delimiter position is set.
. With the "set amp to" and the "set phase to" the amplitude and the phase (between –180 and +180 deg) at the current left or right delimiter position is set.
Pushing the "interpolate amp" button will replace the data points within the action windowThe section of a sound record that will be used for analysis or playback is marked by the two vertical red lines in the sound window. The red lines can be moved by dragging them with the mouse. by a double log interpolation of the data at the delimiters. The result is a straight line in the (double log) amplitude spectrum.
Pushing the "interpolate phase" button will replace the data points within the action windowThe section of a sound record that will be used for analysis or playback is marked by the two vertical red lines in the sound window. The red lines can be moved by dragging them with the mouse. by a log interpolation of the data at the delimiters. The result is a straight line in the (log(f)) phase spectrum.
"Smooth amp" and "smooth phase" carry out 3 point smoothing of the amplitude or the phase spectrum (within the action windowThe section of a sound record that will be used for analysis or playback is marked by the two vertical red lines in the sound window. The red lines can be moved by dragging them with the mouse.) respectively.
With "multiply band by" the data points of the amplitude spectrum within the action windowThe section of a sound record that will be used for analysis or playback is marked by the two vertical red lines in the sound window. The red lines can be moved by dragging them with the mouse. will be scaled by the value as entered in the edit box![]() . If the delimiters are positioned at the extremities of the spectrum, the IR is scaled without deformation.
. If the delimiters are positioned at the extremities of the spectrum, the IR is scaled without deformation.
Pushing the "invert" button is identical to selection of the Sound>invert sound template menu item and will replace the data points of the entire complex spectrum (af + i.bf) of the sound template, irrespective of the position of the delimiters, by 1/(af + i.bf). This action will thus affect both the amplitude and the phase spectrum. It is a necessary step in order to be able to deconvolve sound data using the "convolve" option in the sound tool.
Use the drawing sheet Sound>Set as sound convolution template menu item to declare (tag) the IR as a sound template. The time it takes for the sound to travel between loudspeaker and microphone creates a delay in the IR that can now be removed using the "Rotate n points" button in the Edit IR dialogue box that comes up after selecting the drawing sheet Edit>Edit sound template menu item. The inverse of the IR is obtained by pushing the "invert" push button in the dialogue box or by selecting Sound>Invert sound template from the spreadsheet menu.
Convolve two templates.
Two sound templatesIn this document the words 'sound template', 'impulse response' and 'transfer function', if used in the context of audio data, refer to the same thing, i.e. an array of floating point numbers having a length of a power of 2 (preferably 8192) that is used to convolve audio data prior to sending it to the sound card. may be convolved using this meu item. Select two graphs each containing a single curve. The number of data points has to be a power of two and the same for the two graphs. The order in which the graphs are selected is important for the result. In order to deconvolve two graphs do the following: Select the graph to deconvolve by and make a copy of it on the drawing sheet. Select this copy and issue the Sound>invert sound template command. Select the graph to deconvolve and while maintaining the shift key depressed select the inverted template. Now two graphs are selected. Then issue the Convolve two templates command.
Line-in convolve and play.
This menu option is available after having created and set sound templatesIn this document the words 'sound template', 'impulse response' and 'transfer function', if used in the context of audio data, refer to the same thing, i.e. an array of floating point numbers having a length of a power of 2 (preferably 8192) that is used to convolve audio data prior to sending it to the sound card. for the left and right audio channels. Input to the sound card is read, convolved with the templates and send back to the output of the sound card in real time. Given the amount of calculations to be carried out, this option functions reliably only for µ-processors of over 1 GHz. The input to the sound card may be "line-in" or any device other than the "wave" device. In order to convolve and play music on a CD either the" line-in" or the "CD" device should be used for input and its output to the sound card should be switched off (muted) to prevent the creation of a positive feedback loop. The "wave" device can't be used because Sounds uses it itself. Hence, Windows media player and other multi-purpose players can't be used since they all use the "wave" device. However, many genuine single-purpose CD players are available and usually your CD-ROM unit and/or sound card comes with one. When Line-in convolve and play is active, the dialogue box below is up:
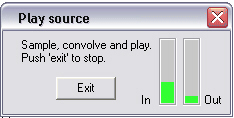
The dialogue box contains two level meters, one for the input and one for the convolved signal that is sent back to the sound card (Out). Both level meters should stay in the green. If clipping occurs, one of the meters will flash red. If the "Out" signal is much larger than the "In" signal, the sound templatesIn this document the words 'sound template', 'impulse response' and 'transfer function', if used in the context of audio data, refer to the same thing, i.e. an array of floating point numbers having a length of a power of 2 (preferably 8192) that is used to convolve audio data prior to sending it to the sound card. should be scaled down using the Edit sound template item from the drawing sheet Edit menu.
On-line noise correlation.
A 16 bit random signal (white or pink noise) is sent to the soundcard at a rate of 44100 samples/s and the input to the soundcard is sampled simultaneously. The input to the sound card should be either "line-in" or "microphone" and other input devices should be muted.
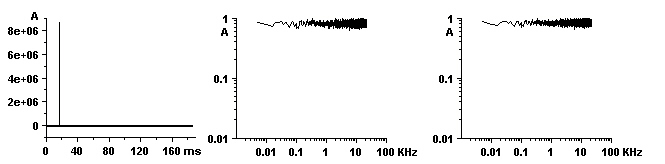
The input and output signals are then cross-correlated and the averaged cross-correlogram along with its frequency spectrum is shown on a new drawing sheet. The graphs on the drawing sheet are updated regularly while correlation proceeds. Given the amount of calculations to be carried out, this option functions reliably only for µ-processors of over 1 GHz and even then the number of background tasks should be reduced to a minimum. In the dialogue box that pops up after selection of this menu item select the number of channels (mono or stereo), the type of noise (white or pink) and the size of the correlation buffer (8192 or 16384 points, representing a duration of 185 and 370 ms respectively). Push "start" to begin correlation and "stop" to terminate.
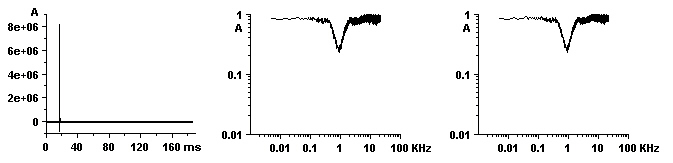
The figures above have been obtained by connecting the line input and line output of a Soundblaster Audigy soundcard with an audio cable. As can be seen from the middle and right spectra, this card is not really too bad, since the spectrum is entirely flat. In the following exercise, the graphical equaliser that comes with the sound card was set such that frequencies around 1 kHz were attenuated –12 dB. Then the average spectra was obtained as described above. Indeed frequencies around 1 kHz are attenuated roughly to 1/4th of the original amplitude.
Next, the line input and the line output were connected via the Resistor Condensor circuit as in the left-most figure underneath:
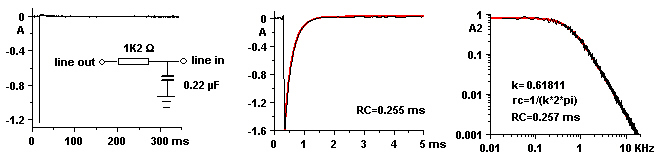
This circuit filters off the high frequency side of the spectrum. The impulse response of the circuit was obtained by online cross correlation (512 sweeps) and is shown on different X-axes on the left and in the middle. The exponential decay was fitted and a relaxation time constant of 0.255 ms was found. A value of 0.264 ms should have been obtained if the values of resitor and the capacitor would have been exact. However according to the manufacturer, both might have an error of 10%. The right most figure shows the power spectrum of the impulse respons. It was fitted with a Lorentzian function, A/((X^2)+(k^2)), and a k of 0.61811 was obtained. This gives a relaxation time constant of 1/(2*π*k)= 0.257 ms.
Create white or pink noise record.
Creates a new *.wav file containing white or pink noise.
In the dialogue window that pops up, select the sample frequency, number of channels (mono or stereo) and the duration of the record. After creation of the file, a new sound window opens showing the result. The random signals in the two channels of a stereo signal are uncorrelated.
Create identity template
In order to help you on the way creating sound templatesIn this document the words 'sound template', 'impulse response' and 'transfer function', if used in the context of audio data, refer to the same thing, i.e. an array of floating point numbers having a length of a power of 2 (preferably 8192) that is used to convolve audio data prior to sending it to the sound card., this and the next item create basic templates that you may then modify. This menu item creates a template consisting of a single, one sample pulse. When sound is convolved with this template, the result will be identical to the original sound.
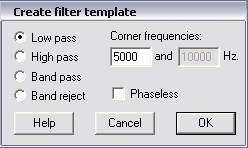
Create filter template
With this template incoming sounds may be filtered. Select low pass, high pass band pass or band reject in the dialogue box that comes up and select the corner frequencies. Check the "phaseless" box to suppress phase shifts during filtering. Then use the Edit sound template menu item to adapt the amplitude of the template.
The Create menu
Synchronous rec/play.
After selecting this menu item, the stretch of sound within the action windowThe section of a sound record that will be used for analysis or playback is marked by the two vertical red lines in the sound window. The red lines can be moved by dragging them with the mouse. starts playing, while at the same time new data is sampled from the sound card. Upon termination of the stretch of sound or after pushing the stop button in the sound tool window, a 'save file' dialogue window pops up. Enter a filename for the new data. The file format will be the same as the current file. Hence, if the original is 16 bit stereo 44 KHz, the new file will be also 16 bit stereo 44 KHz.
Convolve and save..
The current 'wav' file is read, convolved and written to disk under a new filename. This menu option is available after having created and set sound template(s) for the left (and right) audio channels. With the option "As is", Sounds does not check for clipping. With Prevent clipping, the amplitude of the convolved signal is scaled down if this is necessary to prevent clipping. With Maximise resolution, the convolved signal is scaled in order to use the entire dynamical range of the wav format (i.e. 8 or 16 bit integer). Because the latter two options may take twice the time as "As is", it saves time to scale the convolution template(s), using the spreadsheet Sound>Edit sound template menu item when convolving large files.
Spectrum.
Create a frequency spectrum using the data within the action windowThe section of a sound record that will be used for analysis or playback is marked by the two vertical red lines in the sound window. The red lines can be moved by dragging them with the mouse..
Density histogram.
Create a probability-density histogram using the data specified by the action windowThe section of a sound record that will be used for analysis or playback is marked by the two vertical red lines in the sound window. The red lines can be moved by dragging them with the mouse..
Cross correlation.
Create the cross correlogram between two sound records. The records may be the left and right channel in the same sound window or the records in different windows. In the "cross correlation" dialogue box that pops up, select the two records to correlate (record-1 and record-2). If record 1 & 2 are identical, the auto correlogram will be obtained. Only data contained within the action windowThe section of a sound record that will be used for analysis or playback is marked by the two vertical red lines in the sound window. The red lines can be moved by dragging them with the mouse.(s) will be used. If the action windows are of unequal length, the shorter will be assumed and the longer action window will be readjusted and redrawn. If the "new document + spectra" option is chosen, then the routine will return, besides the cross correlogram, the amplitude spectrum and, unless auto correlation is carried out, the phase spectrum.
The Edit menu
Undo..
Undoes the previous action, restores the data.
Copy..
With Edit>Copy a small stretch of sound samples can be copied to the spreadsheet or to the drawing sheet. Because the spreadsheet column length is limited to 65530, the number of samples copied may not exceed 65530. If you have selected a stretch (using the vertical red lines delimiting the action window) that contains more than 65530 samples, a dialogue window will pop up requesting whether you would like to reduce the number of samples either by truncation or by undersampling. Copy can not be used to copy and paste sound tracks from one sound window to another.
Transpose..
Change pitch of the sound record by changing the sample frequency entry (should be <50KHz).
Volume..
In the dialogue box that pops up, the amplification (in % of the actual signal strength) for the left and, if present, the right audio channel can be set. After pushing the OK button, the data within the action window will be scaled and ,depending on the data format, clipped to 8 or 16 bit.
Fade in/out..
The left and right channel audio data in the action window will be multiplied by a linear function going from 0 to 1 for Fade In and from 1 to 0 for Fade Out.
Save prefs..
Save this window's preferences (its size and the position of the action window).