The drawing sheet
The primary function of the drawing sheet is to display graphs that you have created either directly from the input file menu or from a spreadsheet. In addition to this function, you can draw rectangles, circles, lines and add text to your graph to complete the presentation of the data. The graphical elements ("objects") of the drawing sheet are stored internally as vector drawings (as opposed to bitmaps) and can be exported to other vector drawing programs by copying a selection of objects in serf (<Ctrl> C or Edit>Copy from the menu or clicking the copy icon), followed by a "paste" in the receiving program. Another way to export the contents of the drawing sheet to a third party program is to save the graphs in Windows metafile format and reload them in the receiving program. A blank drawing sheet can be created by using the File>new menu option. An existing drawing sheet is read by using the File>open option from the menu or clicking the open file icon
How to select a graphical object.
An object is selected by clicking once on it. Eight little squares then mark the bounding rectangle (selection box) of the selected object. By clicking on empty space between objects, the previous selection is abolished and the selection box disappears.
How to select multiple objects.
Multiple objects can be selected by pressing the <Shift> key on your keyboard, while clicking once on each object to include. To un-select an object in a list of selected objects, click once again on the object you wish to exclude from the selection, while maintaining the <Shift> key depressed. A second way to select multiple objects is to depress the left mouse button and dragging the mouse while keeping the button depressed. All objects that are entirely within the rectangle that now appears will be selected. To select all objects in the current layer, choose Edit>Select all (<Ctrl> A) from the menu. To select all objects on all layers of the sheet, choose Select all layers (<Ctrl> W) from the Edit menu.
How to move objects.
Click once on the object you wish to move, thereby selecting it. Then click again and, while maintaining the left mouse button depressed, drag the object to the new location on the sheet. Multiple objects are moved similarly. This behaviour may be changed using the Edit>Quick move command. In the quick move mode, it is not necessary to select the object before moving it. It suffices to click on the object and while holding down the left mouse button move the mouse. To move multiple objects at the same time in this mode, keep the <Shift> key depressed while selecting and moving.
How to size objects.
Select the object. It has 8 little squares around it. If the mouse cursor gets over one of them it changes into a vertically, horizontally or a diagonally pointing pair of arrows. Depress the left mouse button and drag the pointer until the object has the appropriate size. Use the corner squares to change dimension in two directions and use the other squares to change size in one direction only. If you are sizing objects such as squares or circles, you may wish that the bounding rectangle remains or becomes a square. To do so, press the <Shift> key while dragging, release the <Shift> key only after having released the mouse button.
In order to maintain the original proportions of the object (x and y amplification identical), press the <Ctrl> key and release it after having released the mouse button. N.B. If multiple objects are selected, the effects of the <Shift> and the <Ctrl> keys will apply to the bounding rectangle of the ensemble of objects rather than each individual object.
If text is sized, the result will be the best approximation given the restraints of the true-type character set of the text object in question.
Sizing graphs.
Graphs behave like other objects in this respect with one exception: data-point symbols (squares, circles) will keep their original sizes. Text on the graph axes will also change size, unless the ![]() . Fix text size box in the Axes dialogue window has been checked or the Enable text sizing item in the Tools menu has been unchecked.
. Fix text size box in the Axes dialogue window has been checked or the Enable text sizing item in the Tools menu has been unchecked.
Sizing lines
Sizing lines is slightly different from other objects. When selecting a line segment, only two little selection squares appear at the ends of the line. If the mouse cursor moves over one of them it changes into a cross. Depress the left mouse button and drag it. The end of the line segment will follow the cross. If the <Shift> key is pressed while dragging, the line will become horizontal, vertical or will make an angle of 45° with the x-axis, depending on how close it was to one of those conditions when the <Shift> key was pressed. The <Ctrl> key has no effect here.
Sizing text
If text is sized, the result will be the best approximation given the constraints of the true-type character set of the text object in question. Often one wishes the text size to be identical in all objects on the sheet. To prevent text from scaling each time an object is sized, disable (uncheck) Enable text sizing in the Tools menu.
The drawing tool window
Whenever the window of a drawing sheet is activated (e.g. by clicking on it) its menu replaces the previously displayed menu in the main window and the drawing tool window pops up. The name of the file associated with the drawing window is shown in its title bar. The drawing tool window contains a series of buttons that allow you to draw objects or to modify their appearance. The larger buttons in the upper row are for modification, while the smaller ones in the lower row are mostly for creation. The function of each button will be described in detail below.
Modify the contrast of a bitmap.
![]() This is the default tool upon activation of a drawing window. It is used to select graphical objects on the sheet, to move and to size them using the left mouse button. When drawing a line onto the drawing sheet using the right mouse button while in 'arrow tool' mode and depressing the <ctrl> key, the coordinates of the extremities of the line and it length (in cm) will be transferred to the bottom line of a spreadsheet. Hence, this tool can be used to measure and record distances on the drawing sheet. The coordinate [0,0] is located in the top left corner. If no spreadsheet is open, a new one will be created. If a single spreadsheet is open, the data will be pasted on that one. If more than one spreadsheet is open, a dialogue window will allow choosing between them or to create a new one. It is also possible to select a spreadsheet prior to transfer, or to change spreadsheet later, using the Transfer manual input to ... item from the Tools menu. ↑toolbox↑
This is the default tool upon activation of a drawing window. It is used to select graphical objects on the sheet, to move and to size them using the left mouse button. When drawing a line onto the drawing sheet using the right mouse button while in 'arrow tool' mode and depressing the <ctrl> key, the coordinates of the extremities of the line and it length (in cm) will be transferred to the bottom line of a spreadsheet. Hence, this tool can be used to measure and record distances on the drawing sheet. The coordinate [0,0] is located in the top left corner. If no spreadsheet is open, a new one will be created. If a single spreadsheet is open, the data will be pasted on that one. If more than one spreadsheet is open, a dialogue window will allow choosing between them or to create a new one. It is also possible to select a spreadsheet prior to transfer, or to change spreadsheet later, using the Transfer manual input to ... item from the Tools menu. ↑toolbox↑
![]() Use this tool if you wish to include text in the drawing sheet. The cursor changes shape. The default true-type character set (font) will be used, unless you click on a location that already contains text. In the latter case the original font will be used and text can be modified. You remain in "text mode" until another tool in the
drawing tool window is selected. ↑toolbox↑
Use this tool if you wish to include text in the drawing sheet. The cursor changes shape. The default true-type character set (font) will be used, unless you click on a location that already contains text. In the latter case the original font will be used and text can be modified. You remain in "text mode" until another tool in the
drawing tool window is selected. ↑toolbox↑
alternate characters
To edit an existing polygon, double-click on one of its line segments. Instead of the usual selection box which is marked by eight little squares, the polygon object is highlighted by having little squares at each of its nodes. In addition the mouse pointer changes shape:
To go to the next or to the previous profile, push one of the
The actions of the menu items in this menu are almost identical to those of the
Web mode
Flip vertically, Flip horizontally
Rotate
Get palette from bitmap
Enable text sizing
Web mode
Get length
Spirograph /n
2D Fourier transform to spreadsheet
Move the slide bar
Transfer manual input to ...
Amplitude spectrum
Phase spectrum
Import bitmap
The dialogue box shows the darkest or lowest intensity encountered in the bitmap as well as the brightest or highest intensity found. These numbers can be edited, or the red corsors can be moved to change the settings.
Size maps
Full screen
Scale brightness
Adjust contrast Sharpen bitmap
Smooth
Remove noise
Invert colours
Pseudo colours
Reduce number of colours
Copy window as bitmap
* After having selected a number of graphical objects, these objects can be copied to the clipboard by issuing the Edit>Copy command from the menu, typing <Ctrl> C on the keyboard or by clicking the paste icon
Transparency
Reset histogram size
Add Legend
Remove link
Edit Url (weblink)
Quick move or ctrl M.
* The order in which objects appear on the screen may be changed by one of the Edit>Arrange>xx commands. To make the selected object the front-most object issue Arrange>to front. To move it to the background use Arrange>to back. The Arrange>approach (Ctrl P) or Arrange>remove (Ctrl R) commands do the same thing one step at a time, thus allowing an object to be inserted between two other objects.
Selection of a drawing object may become more difficult if the number of drawing objects on the drawing sheet increases or if a several small objects reside on top of for example a large square or bitmap. In order to prevent inadvertent selection of the wrong object, objects can be organised onto different layers. When working on one layer, objects on other layers are (almost) out of reach of the user. To change layer select Window>Go to layer and select either one of the predefined layers 1 through 10 or select other to go to a layer with a higher index. In the latter case a dialogue box comes up containing an edit box
When double-clicking on one of the elements of a curve in a graph, the "curve properties" dialogue window pops up, allowing the user to edit the attributes of a curve in a graph or to fit a curve. The data points in a graph may be connected by line segments and/or be represented by symbols. Use the "connect points with line" checkbox to switch drawing of line segments on or off. If checked, the "line width" slide bar
The "fit" panel shows three push buttons:
Layout of error bars
To modify the axes of a graph, double click on one of its elements (ticks or text such as the numbers along one of the axes). Make sure that the graph is not associated with other objects. A dialogue window pops up showing both X and Y axis options if the object is a line plot or a wind rose plot and Y-axis options only if the object is a bar plot. For each of the axes the beginning (minimum) and end (maximum) values are defined by the text in the edit boxes
This dialogue window shows the alternate ASCII character set associated with the current text font. Alternate characters can be inserted in a text object being edited by:
1) mouse-selecting a character and pushing the "insert" button in the dialogue box that appears when pushing the ![]() tool or
tool or
2) typing the
The insert button is disabled if no text object is currently being edited. Each drawing sheet has its own alternate character dialogue window, so many of them may be open simultaneously. The font in this window is updated each time a new text object is selected.
↑toolbox↑
![]() Use this tool if you wish to draw a line. The cursor changes shape. After having drawn a line, the default tool (the arrow pointer) automatically replaces it. In order to draw a perfect horizontal, vertical or diagonal line, depress the <Shift> key on the keyboard while you draw a line. ↑toolbox↑
Use this tool if you wish to draw a line. The cursor changes shape. After having drawn a line, the default tool (the arrow pointer) automatically replaces it. In order to draw a perfect horizontal, vertical or diagonal line, depress the <Shift> key on the keyboard while you draw a line. ↑toolbox↑
![]() Use this tool to draw a polygon. With each left-mouse click a node is added. To stop adding nodes, either double-click or click (once) on the first node. The latter method creates a closed figure. In order to draw perfect horizontal, vertical or diagonal lines, depress the <Shift> key on the keyboard while you draw the polygon. A polygon can also be created using the Create polygon command from the spreadsheet menu. ↑toolbox↑
Use this tool to draw a polygon. With each left-mouse click a node is added. To stop adding nodes, either double-click or click (once) on the first node. The latter method creates a closed figure. In order to draw perfect horizontal, vertical or diagonal lines, depress the <Shift> key on the keyboard while you draw the polygon. A polygon can also be created using the Create polygon command from the spreadsheet menu. ↑toolbox↑
![]() This tool is also used to draw a polygon. The difference with the previous tool is that nodes are added whenever the cursor is moved. It may be used for free hand drawing. ↑toolbox↑
This tool is also used to draw a polygon. The difference with the previous tool is that nodes are added whenever the cursor is moved. It may be used for free hand drawing. ↑toolbox↑
![]() In this (move node) mode, each of the nodes can be moved independently of the rest of the polygon by dragging it with the mouse.
Right clicking the mouse changes the mouse pointer successively into:
In this (move node) mode, each of the nodes can be moved independently of the rest of the polygon by dragging it with the mouse.
Right clicking the mouse changes the mouse pointer successively into:
![]() This is the delete node mode. Left-clicking on a node will remove it from the polygon. To delete multiple nodes, draw a rectangle around them.
This is the delete node mode. Left-clicking on a node will remove it from the polygon. To delete multiple nodes, draw a rectangle around them.
![]() This is the add node mode. Left-clicking on a polygon segment will add a node to the polygon.
This is the add node mode. Left-clicking on a polygon segment will add a node to the polygon.
![]() In this mode you can modify the aspects of your Bezier-polygon. This mode is available only if the "Bezier property" has been set with the Tools menu. ↑toolbox↑
In this mode you can modify the aspects of your Bezier-polygon. This mode is available only if the "Bezier property" has been set with the Tools menu. ↑toolbox↑
![]() This is the cut polygon mode. Left-clicking on a polygon segment will cut the polygon in two. This mode will not be available if the polygon's "Bezier property" has been set. ↑toolbox↑
This is the cut polygon mode. Left-clicking on a polygon segment will cut the polygon in two. This mode will not be available if the polygon's "Bezier property" has been set. ↑toolbox↑
When in polygon edit mode, use "undo" from the menu to undo the last move, addition or deletion.
Click the ![]() button to quit the polygon edit mode. Then you might use "undo" from the menu to restore the original polygon. ↑toolbox↑
button to quit the polygon edit mode. Then you might use "undo" from the menu to restore the original polygon. ↑toolbox↑
![]() Use this tool to draw a transparent (open) rectangle. In order to draw a perfect square, keep the <Shift> key depressed while you draw. The cursor changes back into the pointer tool after having drawn the rectangle. ↑toolbox↑
Use this tool to draw a transparent (open) rectangle. In order to draw a perfect square, keep the <Shift> key depressed while you draw. The cursor changes back into the pointer tool after having drawn the rectangle. ↑toolbox↑
![]() Use this tool to draw a filled rectangle. In order to draw a perfect square, keep the <Shift> key depressed while you draw. The cursor changes into the pointer tool after having drawn the rectangle. ↑toolbox↑
Use this tool to draw a filled rectangle. In order to draw a perfect square, keep the <Shift> key depressed while you draw. The cursor changes into the pointer tool after having drawn the rectangle. ↑toolbox↑
![]() Use this tool to draw a transparent (open) ellipse. In order to draw a perfect circle, keep the <Shift> key depressed while you draw. The cursor changes into the pointer tool after having drawn the ellipse. ↑toolbox↑
Use this tool to draw a transparent (open) ellipse. In order to draw a perfect circle, keep the <Shift> key depressed while you draw. The cursor changes into the pointer tool after having drawn the ellipse. ↑toolbox↑
![]() Use this tool to draw a filled (closed) ellipse. In order to draw a perfect circle, keep the <Shift> key depressed while you draw. The cursor changes into the pointer tool after having drawn the ellipse. ↑toolbox↑
Use this tool to draw a filled (closed) ellipse. In order to draw a perfect circle, keep the <Shift> key depressed while you draw. The cursor changes into the pointer tool after having drawn the ellipse. ↑toolbox↑
![]() With the magnifying glass you can zoom in into a particular scene of the drawing. The centre of magnification will be where you left mouse click on the sheet. To zoom out, right mouse click on the sheet. The tool will remain the magnifying glass until you select another tool. Besides using the magnifying glass, one can zoom in (forward) by typing <Ctrl> F or zoom out (backward) by typing <Ctrl> B.
↑toolbox↑
With the magnifying glass you can zoom in into a particular scene of the drawing. The centre of magnification will be where you left mouse click on the sheet. To zoom out, right mouse click on the sheet. The tool will remain the magnifying glass until you select another tool. Besides using the magnifying glass, one can zoom in (forward) by typing <Ctrl> F or zoom out (backward) by typing <Ctrl> B.
↑toolbox↑
![]()
![]() Clusters uses 8 bit indexed colour (256 colours) objects having palettes that may be different for each drawing window and that may be modified by the user. To find out what are the colour and the colour index of a particular pixel on the sheet, use the pipette tool. When clicking on a location on the sheet, the box right of the pipette tool (the colour index box) will indicate the colour and its index. The pipette will stay until another tool is selected. If you select an object on the drawing sheet using the pointer tool and then right mouse click on the colour index box, then the fill colour of the selected object will change into the pipette colour. Left mouse clicking on the colour index box will change the border colour of the object. ↑toolbox↑
Clusters uses 8 bit indexed colour (256 colours) objects having palettes that may be different for each drawing window and that may be modified by the user. To find out what are the colour and the colour index of a particular pixel on the sheet, use the pipette tool. When clicking on a location on the sheet, the box right of the pipette tool (the colour index box) will indicate the colour and its index. The pipette will stay until another tool is selected. If you select an object on the drawing sheet using the pointer tool and then right mouse click on the colour index box, then the fill colour of the selected object will change into the pipette colour. Left mouse clicking on the colour index box will change the border colour of the object. ↑toolbox↑
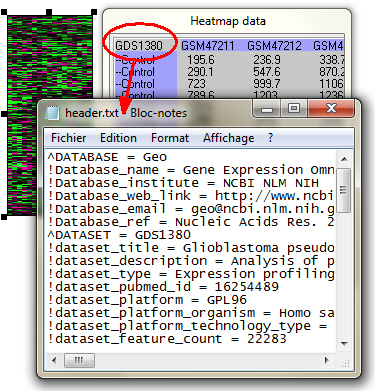
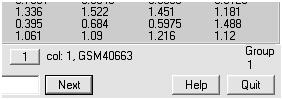
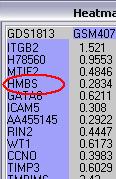
![]() . The dialogue box "heatmap data" shown below appears. When the pipette hovers above the map, a yellow square appears in the dialogue box indicating the entry that the pipette points at. At this point the pipette can be moved one entry at the time by pushing the arrow keys on the keyboard. If the control key is held while pushing the arrow keys, the pipette moves half a page at the time. Use the page-up, page-down, home and end keys to move to the extremities of the data matrix. With a click of the left mouse button on the heatmap, a copy of the data as shown in the dialogue box is made that can then be pasted on a spreadsheet. With the "Search label" edit box and the "Next" button, text in the blue column and row can be searched.
. The dialogue box "heatmap data" shown below appears. When the pipette hovers above the map, a yellow square appears in the dialogue box indicating the entry that the pipette points at. At this point the pipette can be moved one entry at the time by pushing the arrow keys on the keyboard. If the control key is held while pushing the arrow keys, the pipette moves half a page at the time. Use the page-up, page-down, home and end keys to move to the extremities of the data matrix. With a click of the left mouse button on the heatmap, a copy of the data as shown in the dialogue box is made that can then be pasted on a spreadsheet. With the "Search label" edit box and the "Next" button, text in the blue column and row can be searched.
The original SOFT file header appears in your text editor if you double-click the upper right corner of the heatmap dialogue box.
The pipette dialogue box closes upon clicking "Quit". ↑toolbox↑
![]() This box shows the current default font as well as the default text, border and fill colours. If no object is selected, this box displays the current default background colour (here yellow), foreground colour (here blue) and the size and name of the current default true-type font ("Arial" in this example). If one or more objects are selected, this box indicates the properties of the object(s) selected. If you wish to change the border colour of a selected object into the current foreground colour, left mouse click in this box. To change the fill colour, right mouse click.
This box shows the current default font as well as the default text, border and fill colours. If no object is selected, this box displays the current default background colour (here yellow), foreground colour (here blue) and the size and name of the current default true-type font ("Arial" in this example). If one or more objects are selected, this box indicates the properties of the object(s) selected. If you wish to change the border colour of a selected object into the current foreground colour, left mouse click in this box. To change the fill colour, right mouse click.
![]() Has the same effect as the menu item Tools>Text Font. If no objects on the drawing sheet are selected, this option will allow you to set the default true type font. If a (text) object is selected it will allow you to change its font. When editing a text object, an alternate dialogue window pops up allowing insertion of special characters, such as ± or 2.
↑toolbox↑
Has the same effect as the menu item Tools>Text Font. If no objects on the drawing sheet are selected, this option will allow you to set the default true type font. If a (text) object is selected it will allow you to change its font. When editing a text object, an alternate dialogue window pops up allowing insertion of special characters, such as ± or 2.
↑toolbox↑
![]() If a text object is selected, this option will rotate the text 45' or 90'. Use the rotate tool to rotate text over arbitrary angles.
↑toolbox↑
If a text object is selected, this option will rotate the text 45' or 90'. Use the rotate tool to rotate text over arbitrary angles.
↑toolbox↑
![]() Has the same effect as the menu item Tools>Align. Use this button to align and/or redistribute multiple selected objects. A dialogue window pops up in which you can specify the alignment. The following alignment rules are observed:
Has the same effect as the menu item Tools>Align. Use this button to align and/or redistribute multiple selected objects. A dialogue window pops up in which you can specify the alignment. The following alignment rules are observed:
1) If "line width" is unchecked, the floating point coordinates of the extremes (left-most, top-most etc.) of the object are used for alignment. If "line width" is checked, half the line width (=pensize) is added to the extremes for alignment.
2) Text bottom alignment refers to the imaginary line the text is sitting on, ignoring eventual underhang (as in the letter "g"). Hence the letters "a" and "q" will be aligned conventionally as in this text. Text top alignment will be carried out with respect to the upper limit of the bounding selection rectangle (the box on the sheet with the 8 little squares).
3) Redistribution is carried out with respect to the outer-most objects.
↑toolbox↑
![]() To change the colour of text, lines and border lines of objects click this button. A dialogue window displaying the palette associated with the current drawing sheet pops up. The current border colour of the object is highlighted by a white square. If you click in one of the little squares the border lines of the object change colour and the dialogue window disappears. The first little box in the palette (index=0) is transparent. Hence, it will remove the border lines of the object (unless the object is a line or text, since the object would disappear altogether). If the selected object is an undissociated graph, the colour of the axes will change. To change the colour of other elements of a graph, double click on the element concerned. If this option is used while no object is selected, the default line colour will be changed.
↑toolbox↑
To change the colour of text, lines and border lines of objects click this button. A dialogue window displaying the palette associated with the current drawing sheet pops up. The current border colour of the object is highlighted by a white square. If you click in one of the little squares the border lines of the object change colour and the dialogue window disappears. The first little box in the palette (index=0) is transparent. Hence, it will remove the border lines of the object (unless the object is a line or text, since the object would disappear altogether). If the selected object is an undissociated graph, the colour of the axes will change. To change the colour of other elements of a graph, double click on the element concerned. If this option is used while no object is selected, the default line colour will be changed.
↑toolbox↑
![]() To change the fill colour of objects click this button. A dialogue window displaying the palette associated with the current drawing sheet pops up. The current fill colour of the object is highlighted by a white square. Clicking in one of the little squares changes the fill colour of the object and the dialogue window disappears. The first little box in the palette (index=0) is transparent. Hence it will change a filled square into a open square. If the selected object is an undissociated graph, double click on the element concerned. If this option is used while no object is selected, the default fill colour will be changed.
↑toolbox↑
To change the fill colour of objects click this button. A dialogue window displaying the palette associated with the current drawing sheet pops up. The current fill colour of the object is highlighted by a white square. Clicking in one of the little squares changes the fill colour of the object and the dialogue window disappears. The first little box in the palette (index=0) is transparent. Hence it will change a filled square into a open square. If the selected object is an undissociated graph, double click on the element concerned. If this option is used while no object is selected, the default fill colour will be changed.
↑toolbox↑
![]() Use this tool to modify the style of a line into a dotted or dashed one or to add arrow heads to the ends of a line or a polygon. ↑toolbox↑
Use this tool to modify the style of a line into a dotted or dashed one or to add arrow heads to the ends of a line or a polygon. ↑toolbox↑
![]() Has the same effect as the menu item Tools>Pen Size. Click this button to change line width (pensize). A dialogue window pops up indicating the current line width of the object. Upon selection of the new width, the dialogue window disappears. If the selected object is a graph, the line width of the axes will change. To change the line width of other elements of a graph, double click on the element concerned. If this option is used while no object is selected, the default pensize will be changed. Pen size is in computer screen pixels. When printing a drawing sheet the overall appearance of the design will remain the same. Hence, the resolution may change when printing, but not the line width.
↑toolbox↑
Has the same effect as the menu item Tools>Pen Size. Click this button to change line width (pensize). A dialogue window pops up indicating the current line width of the object. Upon selection of the new width, the dialogue window disappears. If the selected object is a graph, the line width of the axes will change. To change the line width of other elements of a graph, double click on the element concerned. If this option is used while no object is selected, the default pensize will be changed. Pen size is in computer screen pixels. When printing a drawing sheet the overall appearance of the design will remain the same. Hence, the resolution may change when printing, but not the line width.
↑toolbox↑
![]() When this tool is chosen, the arrow pointer changes into a
When this tool is chosen, the arrow pointer changes into a ![]() pointer and one can rotate the image within the currently selected bitmap, datapoints in a 3D graph or rotate any other object on the drawing sheet using the mouse or the keyboard arrows. Using the arrows will change the angle of rotation by 1' increments. Simultaneously pressing the <Ctrl> key will increase the increment to 45'. The centre of rotation is located in the centre of the image. The actual angle of rotation (in degrees) is shown in the status bar (the lower bar of the program's window). The precision of rotation increases by removing the mouse pointer further from the centre of rotation.
pointer and one can rotate the image within the currently selected bitmap, datapoints in a 3D graph or rotate any other object on the drawing sheet using the mouse or the keyboard arrows. Using the arrows will change the angle of rotation by 1' increments. Simultaneously pressing the <Ctrl> key will increase the increment to 45'. The centre of rotation is located in the centre of the image. The actual angle of rotation (in degrees) is shown in the status bar (the lower bar of the program's window). The precision of rotation increases by removing the mouse pointer further from the centre of rotation.
If a 3D graph is selected, then a horizontal movement turns the graph around the vertical axis. A vertical movement turns the graph around the horizontal axis. Horizontal movements are ignored if the <Shift> key is depressed. The graph turns around the axis perpendicular to the screen if the <Ctrl> key is depressed.
The rotation mode remains active until another tool, such as the arrow tool, is selected from the drawing toolbox. See the Rotate bitmap menu item for further details and options. ↑toolbox↑
Demo:
"3d graph" should be viewed full screen (HD)
![]() With this tool parts of bitmaps, polygons or associated objects may be dissected and copied in place. When clicking the tool, the cursor changes into an alternate arrow pointer. Use it to draw a selection rectangle onto the drawing sheet. Upon release of the left mouse button a new (associated) object will be created in place containing a duplicate of each object within the selection rectangle, also if it was part of an associated object. If the selection rectangle partly overlaps a bitmap or polygon, only that part of the bitmap or polygon will be duplicated that is within the bounding rectangle. Hence the main interest of this tool is to cut out and duplicate parts of bitmaps and polygons. If a single object is selected (highlighted by 8 small squares around it) prior to choosing the tool, only (part of) the highlighted object will be duplicated, ignoring other objects that might be within the selection rectangle.
↑toolbox↑
With this tool parts of bitmaps, polygons or associated objects may be dissected and copied in place. When clicking the tool, the cursor changes into an alternate arrow pointer. Use it to draw a selection rectangle onto the drawing sheet. Upon release of the left mouse button a new (associated) object will be created in place containing a duplicate of each object within the selection rectangle, also if it was part of an associated object. If the selection rectangle partly overlaps a bitmap or polygon, only that part of the bitmap or polygon will be duplicated that is within the bounding rectangle. Hence the main interest of this tool is to cut out and duplicate parts of bitmaps and polygons. If a single object is selected (highlighted by 8 small squares around it) prior to choosing the tool, only (part of) the highlighted object will be duplicated, ignoring other objects that might be within the selection rectangle.
↑toolbox↑

![]() If a single bitmap object is selected, the drawing toolbox expands, showing this bitmap-specific tool. Its action is identical to the Bitmap>Adjust contrast menu item and allows for changing the contrast of the image. The "bitmap contrast" dialogue box shown below displays one out of five available response curves or "profiles" that determine how the intensity of each pixel in the bitmap will be modified when pushing the "OK" button. The five profiles are followed by three more profiles that apply to a single primary colour only: red green or blue.
If a single bitmap object is selected, the drawing toolbox expands, showing this bitmap-specific tool. Its action is identical to the Bitmap>Adjust contrast menu item and allows for changing the contrast of the image. The "bitmap contrast" dialogue box shown below displays one out of five available response curves or "profiles" that determine how the intensity of each pixel in the bitmap will be modified when pushing the "OK" button. The five profiles are followed by three more profiles that apply to a single primary colour only: red green or blue.
In the profile, current intensity runs from left (black) to right (white) and the new, modified, intensity runs from bottom to top. In order to increase contrast, choose a slope larger than unity. Inversely, to decrease contrast choose a slope less than unity. To invert the colours of an image choose a slope of -1. Other effects, such as solarisation, can be obtained with still other profiles, which may be of the user's design.
Example:

![]()
![]() buttons. To modify the current profile do either of the following:
buttons. To modify the current profile do either of the following:
1) change slope and offset using the slide bars![]() . Note that the slope changes polarity (from +1 to -1 or vice versa) when the slide bar
. Note that the slope changes polarity (from +1 to -1 or vice versa) when the slide bar![]() cursor is in the middle.
cursor is in the middle.
2) Click on one of the nodes in the profile and move it up or down, while keeping the left mouse button depressed.
Use the "Save" and "Load" buttons to save and load your profiles on (from) disk. Pushing the "default" button will restore the default profiles. ↑toolbox↑
The Tools menu
![]() Align,
Align, ![]() Outline colour,
Outline colour, ![]() Fill colour,
Fill colour, ![]() Text Font and
Text Font and ![]() Pen Size icons in the drawing tool box. In short: they allow you to align multiple objects, to change the (border-)line colour, the fill colour, true-type text font (size, bold etc.) and the width of lines respectively.
In order to change the colour palette of the current (and only the current) sheet, choose either the Outline colour or Fill colour menu item. Upon selection of one of these menu items a dialogue window pops up that contains, apart from the option to select a new colour index, several options to change the red-green-blue values of the palette entries.
Pen Size icons in the drawing tool box. In short: they allow you to align multiple objects, to change the (border-)line colour, the fill colour, true-type text font (size, bold etc.) and the width of lines respectively.
In order to change the colour palette of the current (and only the current) sheet, choose either the Outline colour or Fill colour menu item. Upon selection of one of these menu items a dialogue window pops up that contains, apart from the option to select a new colour index, several options to change the red-green-blue values of the palette entries.
If this mode is selected, you can follow the Internet links that you have associated with your graphical objects using the Edit>Edit URL (weblink) menu item. You can not modify or otherwise manipulate the objects until 'Webmode' is deselected again.
These items from the Tools pull-down menu are for transforming the currently selected objects into their mirror images. Text objects may change position if they are part of a multiple selection, but will remain normal readable text objects. Similarly, undissociated histograms will not be transformed in their mirror images, but may change position if part of a multiple selection.
This menu option has a different effect if only a bitmap or if only a 3D object or other object(s) is selected. In the dialogue box that comes up, one of two options may be chosen: "freehand" or a specific angle of rotation. If freehand is chosen, then the arrow pointer changes into a ![]() pointer and one can rotate the bitmap or the (3D) object using the mouse or the keyboard arrows.
pointer and one can rotate the bitmap or the (3D) object using the mouse or the keyboard arrows.
Objects other than bitmaps and (3D) graphs: rotates the selected object(s) over its/their centre. If multiple objects are selected containing graphs or bitmaps, only their centres will be rotated over the centre of the composite object. Graphs can not be rotated. If you wish to rotate a graph, dissociate it first in a set of graphical objects. Note that dissociating a graph into its components will destroy associated data and link.
Bitmap: Using the arrows will change the angle of rotation by 1' increments. Simultaneously pressing the <Ctrl> key will increase the increment to 45'. This option is equivalent to pushing the ![]() tool in the drawing toolbox. The centre of rotation is located in the centre of the image. The actual angle of rotation (in degrees) is shown in the status bar (the lower bar of the program's window). The precision of rotation increases by removing the mouse pointer further from the centre of rotation. The rotation mode remains active until another tool, such as the arrow tool, is selected from the drawing toolbox.
Bitmaps are rectangular objects having horizontal and vertical borders. When rotating an image over for example 45', the pixel colours at the corners of the rectangle become undefined. These pixels will be attributed the colour marked as "fill colour" in the dialogue box. To change the fill colour push the "fill colour" button and select one in the second dialogue box that pops up. If the "keep bitmap size" box is checked, part of the rotated image disappears because it lies outside the bitmap boundaries. Uncheck this box in order to replace the original bitmap by one that will be just as large as to contain the entire rotated image (apparent after the rotation is done).
tool in the drawing toolbox. The centre of rotation is located in the centre of the image. The actual angle of rotation (in degrees) is shown in the status bar (the lower bar of the program's window). The precision of rotation increases by removing the mouse pointer further from the centre of rotation. The rotation mode remains active until another tool, such as the arrow tool, is selected from the drawing toolbox.
Bitmaps are rectangular objects having horizontal and vertical borders. When rotating an image over for example 45', the pixel colours at the corners of the rectangle become undefined. These pixels will be attributed the colour marked as "fill colour" in the dialogue box. To change the fill colour push the "fill colour" button and select one in the second dialogue box that pops up. If the "keep bitmap size" box is checked, part of the rotated image disappears because it lies outside the bitmap boundaries. Uncheck this box in order to replace the original bitmap by one that will be just as large as to contain the entire rotated image (apparent after the rotation is done).
3D object: When moving the corsor up or down, the 3D object wil be rotated over the horizontal axis (X axis). Moving it left or right will rotate the 3D object over the vertical axis (Y axis). If you hold down the <Ctrl> key, the 3D object will be rotated over the axis that is perpendicular to the screen (Z axis). Holding the <Shift> key down will rotate the 3D object only over the vertical axis, ignoring vertical movements.
 Perspective
A 3D graph is shown per default in geometric projection. With this command a perspective transformation can be carried out. Select![]() "perspective" In the dialogue box that appears and choose a "zoom" to modulate the perspective effect. High zoom means that you approach the object.
"perspective" In the dialogue box that appears and choose a "zoom" to modulate the perspective effect. High zoom means that you approach the object. Split graph
Although this tool works fine as well with 2D graphs, it has been designed especially to separate clouds of data in 3D graphs. The graph below has been rotated (as explained in the preceding section) such that two lumps of points seem apparent. Use the ![]() or another drawing tool to encircle the points that you wish to separate from the others as shown in the figure below. Then select both the graph and the polygon (or circle or square) and issue the Split graph command. The single 3D curve will then be split in two curves one of which will be with red symbols:
or another drawing tool to encircle the points that you wish to separate from the others as shown in the figure below. Then select both the graph and the polygon (or circle or square) and issue the Split graph command. The single 3D curve will then be split in two curves one of which will be with red symbols:
As indicated above, the colour palette may be modified by using Tools>outline colour or the Tools>fill colour menu items. An alternative way to modify the palette is to extract it from a bitmap on the sheet. When issuing the Get palette from bitmap command, a new palette will be calculated based on the colours present in the bitmap. Note that the first three colours of the palette remain unchanged, since they have a special meaning for the sheet: transparent, background colour and pen colour.
If an object containing text is sized, the font size changes as well. To prevent text from scaling, uncheck this menu item.
This menu item toggles between normal and web mode. In normal mode (i.e. not in web mode), mouse-clicking on an object selects it as usual. Clicking on an object when in web mode results in loading a page or file that the hyperlink, associated with the object, is pointing to. The hyperlink may be an html page on the internet (e.g. http://bram.org) or a file on the hard disk (e.g. C:/a-folder/some-file.his). Per default objects have no hyperlink. A link can be associated with an object using the Edit>Edit Url (weblink) menu item. When in web mode, objects cannot be selected and most object manipulation menu-items are inactive (greyed).
Use this menu option to determine the length of a line or a polygon object [in cm on the drawingsheet]. Note that an alternative method to measure distances on the sheet exists. It consists of pushing the control <ctrl> key and then drawing a line on the sheet with the right mouse button pressed.
 (Un)set Bezier property
After drawing a polygon on the sheet, the points defining the polygon are connected with straight lines. When setting the Bezier property, they may be connected by curved lines, by a proces called Bezier-blending. To do so, choose (Un)set Bezier property from the Tools menu or right-click on the polygon and select Set Bezier property from the pop-up menu.
Now double click on the polygon, apon which a new cursor appears ![]() . Using this cursor you can move nodes with respect to the others, but that is not what we'll do now. Next, right-click until the
. Using this cursor you can move nodes with respect to the others, but that is not what we'll do now. Next, right-click until the ![]() cursor appears and the polygon object shows little balls-on-sticks at each node (the sticks are very short in the beginning).
By movig the small balls around the shape of the object changes.
cursor appears and the polygon object shows little balls-on-sticks at each node (the sticks are very short in the beginning).
By movig the small balls around the shape of the object changes.


Finally select the pointer tool ![]() from the drawing toolbox to stop editing. An example.
from the drawing toolbox to stop editing. An example.
A spirograph was originally an instrument to make the design of bank notes difficult to imitate. Since then it has become a amusing toy with which complicated figures can be drawn. In the dialogue box that is associated with this menu item you can chose up to 10 spacial frequencies. Frequency 1 (here with an amplitude of 50) corresponds to a simple circle with a radius of 50 pixels on the computer screen. The figures become more intricate as frequency components are added. Note that positive and negative frequencies do not give the same result if combined with other components (see figure below for an example).

With this command the complex Fourier transform of a set of (x,y) coordinates on a plane (e.g. an object created with a polygon tool ![]() or
or ![]() ) will be taken and copied to a newly created spreadsheet. Follow this link to know more about the 2D Fourier Transform. The spirograph objects above have been created using the inverse 2D FT.
) will be taken and copied to a newly created spreadsheet. Follow this link to know more about the 2D Fourier Transform. The spirograph objects above have been created using the inverse 2D FT.
/n


Use this option to retrieve information from your frequency histogram (created with the Modify/Stats>Frequency histogram of the spreadsheet menu):![]() gadget to displace the green vertical lines that now show up in the graph. Several variables contained within the range of points delineated by the green vertical lines are calculated. They can be copied or transferred to a spreadsheet. Only the variables selected with the checkboxes will be copied.
gadget to displace the green vertical lines that now show up in the graph. Several variables contained within the range of points delineated by the green vertical lines are calculated. They can be copied or transferred to a spreadsheet. Only the variables selected with the checkboxes will be copied.
When in Polygon tracking or when drawing a line onto the drawing sheet using the right mouse button while in 'arrow tool' mode (and depressing the <ctrl> key) the coordinates of the extremities of the line and it length (in cm) will be transferred to the bottom line of a spreadsheet. If no spreadsheet is open, a new one will be created. If a single spreadsheet is open, the data will be pasted on that one. If more than one spreadsheet is open, a dialogue window will allow choosing between them or to create a new one. It is possible to select a spreadsheet prior to transfer, or to change spreadsheet later, using this menu item.
If the currently selected object is a histogram, the amplitude spectrum of the data depicted in that histogram is taken and plotted on a new drawing sheet. This menu item is only useful for histograms containing a single curve. If the histogram contains more than one curve, only the spectrum of one curve is taken.
If the currently selected object is a histogram, the phase spectrum of the data depicted in that histogram is taken and plotted on a new drawing sheet. This menu item is only useful for histograms containing a single curve. If the histogram contains more than one curve, the spectrum of only one curve is taken.
The Bitmap menu
Windows bitmaps (*.BMP), uncompressed TIFF bitmaps and JPEG bitmaps may be added to the drawing sheet using this menu option or by pushing the ![]() button. A rectangular object with the proportions of the original image (but usually of smaller size) will be created. The border colour and border line width can be changed as for rectangles. The image can be sized as the other objects. Press the <Ctrl> key while sizing if you wish the original proportions to be conserved.
button. A rectangular object with the proportions of the original image (but usually of smaller size) will be created. The border colour and border line width can be changed as for rectangles. The image can be sized as the other objects. Press the <Ctrl> key while sizing if you wish the original proportions to be conserved.
To restore the height/width proportion, double click on the image. In the dialogue box that appears, change the horizontal and vertical resolutions to identical values or click one of the buttons "1/8", "1/4" etc. The button "1" sets the horizontal and vertical resolutions to the monitor screen resolution of 72 pixels/inch. The button "1/2" sets the image size to half (144 p/i) etc. Most printers have at least a resolution of 600 pixels/inch.
 A second way to import a bitmap is by copying it from a bitmap editor such as Photoshop and pasting it on the drawing sheet. If a 16 bit TIFF bitmap is imported, it needs to be converted to 8 bits. To minimise quality loss a dialogue box comes up requesting the range of intensities in the 16 bit bitmap to convert.
Bitmaps can be exported similarly or by issuing the command Bitmap>Save bitmap or by pushing the ![]() button.
button.
 Save bitmap
This menu option is enabled if a single bitmap object is selected. Select the bitmap format in the first dialogue window that pops up. Note that the 16-bit bitmap (32768 colours, a Windows 3.x format) is now almost obsolete and most bitmap programs such as Photoshop and Corel Photopaint will refuse to load it.
Enter a file name in the next dialogue window that pops up. Note the difference with the menu item Copy window as bitmap.
Bitmaps can also be saved by clicking the ![]() button or by pressing <Ctrl> S. Select the number of bitmap colours and the file format (bmp,jpg or gif). Note that if no bitmap is selected, <Ctrl> S will save the drawing sheet (in *.his format).
button or by pressing <Ctrl> S. Select the number of bitmap colours and the file format (bmp,jpg or gif). Note that if no bitmap is selected, <Ctrl> S will save the drawing sheet (in *.his format).
With this option multiple bitmaps can be sized simultaneously. To do so, select the bitmaps to size and then issue the Size maps command from the Bitmap menu (or press <Ctrl> T). A dialogue box will pop up that allows you to choose between full size (1), one eighth, a quarter of or half the original size.
Note that bitmaps may also be sized as any other object, i.e. : select the object. It has 8 little squares around it. If the mouse cursor gets over one of them it changes into a vertically, horizontally or a diagonally pointing pair of arrows. Depress the left mouse button and drag the pointer until the object has the appropriate size. Use the corner squares to change dimension in two directions and use the other squares to change size in one direction only. In order to maintain the original proportions of the object (x and y amplification identical), press the <Ctrl> key and release it after having released the mouse button.
A third way to size a bitmap is to double click on the image. In the dialogue box that appears, change the horizontal and vertical resolutions to the values of your choice.
Use this option to display the currently selected bitmap full screen or type <Ctrl> O. Type the <escape> key to return to the program. If you have two display monitors, you may display a bitmap on the auxiliary monitor using <Ctrl> I.
The colour of each pixel of a bitmap in this software is encoded by three bytes (a byte is a small integer number that can take on values between 0 and 255): one byte for the blue component, one for green and one for red. If the pixels in the bitmap have values that are all below 150 for example, then using Bitmap>Scale brightness>all multiplies all pixel values with a factor (255/150 in this case) such that the whole range of values between 0 and 255 is used. With Bitmap>Scale brightness>Red only the red component is scaled. Scale brightness>Green and Scale brightness>Blue function similarly.Note that carrying out one after the other Scale brightness>Red, Scale brightness>Green and Scale brightness>Blue does not give the same result as Scale brightness>all, because in the latter case the scaling factor for all three components is the same and depends on the highest byte value found, irrespective of colour.
This menu option is described in detail elsewhere.
Sharpens the contours of subjects in the image by passing a 3x3 convolution matrix with preset values.
This menu option is enabled only if a single bitmap object is selected. The bitmap is passed through a 3x3-pixel (GaussianA Gaussian filter takes the weighed mean (a bell-shaped function) of the central pixel and its neighbour pixels. The mean is then attributed to the central pixel.) smoothing filter.

Original + noise Smoothing filter Median filter
This menu option is enabled only if a single bitmap object is selected. The bitmap is passed through a 3x3-pixel median filterA median filter sorts the centre pixel and its neighbour pixels according to intensity. The intensity of the pixel in the middle of the sorted list is then attributed to the central pixel..
The colours of the currently selected bitmap will be changed into their complements using this option. Hence yellow will turn blue and black will become white.
The colours of a bitmap may be replaced by a pseudo colour gradient. In the dialogue window that pops up after selecting this menu item, the gradient is shown on the left and three sets of three slide bars
![]() on the right. With the slide bars
on the right. With the slide bars![]() the red (R), green (G) and blue (B) components of bottom, middle and top colours of the gradient can be set. The middle colour settings will be ignored if the
the red (R), green (G) and blue (B) components of bottom, middle and top colours of the gradient can be set. The middle colour settings will be ignored if the ![]() box is unchecked. To see the effect of the settings on the currently selected bitmap check the "preview" box. Click "OK" to apply the pseudo colour gradient to the current bitmap.
If a pseudo colour gradient had been applied to the bitmap before, the text underneath the gradient shows "This bitmap has pseudo-colours". In that case, the gradient shown in the dialogue box corresponds to the current bitmap gradient rather than the default gradient. The default corresponds to the last gradient applied to one of the the drawing sheet's bitmaps (allowing to apply the same gradient to multiple bitmaps) or, if none had been applied, the program default.
Pushing the "Make Bar" button creates a new bitmap object on the drawing sheet containing the gradient. This menu item is enabled only if a single bitmap object is selected.
box is unchecked. To see the effect of the settings on the currently selected bitmap check the "preview" box. Click "OK" to apply the pseudo colour gradient to the current bitmap.
If a pseudo colour gradient had been applied to the bitmap before, the text underneath the gradient shows "This bitmap has pseudo-colours". In that case, the gradient shown in the dialogue box corresponds to the current bitmap gradient rather than the default gradient. The default corresponds to the last gradient applied to one of the the drawing sheet's bitmaps (allowing to apply the same gradient to multiple bitmaps) or, if none had been applied, the program default.
Pushing the "Make Bar" button creates a new bitmap object on the drawing sheet containing the gradient. This menu item is enabled only if a single bitmap object is selected.
A dialogue box requesting the number of colours will appear:
 The number of colours may vary between 2 and 256. The resulting bitmap will be a colour-indexed, i.e. a bitmap that refers to a palette to define its colours. If you leave the "Impose the currently active palette" box unchecked, a new palette will be calculated for the bitmap. If you choose to impose the currently active palette, then the bitmap will use the currently active palette. The currently active palette is the palette that is associated with the drawing sheet. This palette may be changed using the Tools>outline colour, Tools>fill colour or the Tools>Get palette from bitmap menu items. As the first three colours of the palette have a special meaning for the drawing sheet (transparent, background and foreground colour), they will not be used to create the new bitmap. The first usable colour index starts at 3 (the 4th colour box in the palette). Note that if you use less than 256 colours, for example 4, then only the colours 3 through 7 will be used. This will be 3 through 19 if you choose 16 colours, etc.

Change resolution
With this menu item reduces the horizontal and vertical resolution of the currently selected bitmaps can be modified using the dialogue window shown on the left.
First, change a value in one of the edit boxes and then push the 'Set' button to see the effect on the other parameters. Select 'Conserve proportions' if you wish that the ratio witdt/height remains constant. Finally push 'OK'.
The current window or the entire drawing sheet is copied to the clipboard in windows bitmap (*.BMP) format when selecting this menu item. The resolution can be chosen in the dialogue box that will pop up. The contents of the clipboard may then be pasted in a program that accepts bitmaps (photoshop, corel photopaint etc.) for further modification.
 Slide show
You can show your bitmaps at full screen using this option. The bitmaps should reside in a single folder, on a drawing sheet or their location should be specified in a text file. You can set the interval between successive slides in the dialogue window that comes up. If you have a second display monitor then you can choose to alternate between the two displays. The resolution of the two displays need to be identical. Type the <escape> key to quit the slide show. If you specify the location of the bitmap files in a *.txt file, please observe the following rules (see the figure below). The text file should be in tab-delimited format, just as Clusters's spreadsheet format. The first column should contain the path to the bitmap, the second and third columns are optional and specify the monitors on which the bitmaps should be displayed. 1 is for the principal monitor and 2 is for the auxiliary monitor. The third column specifies the time in ms until the next slide. Note that the file should be saved in TXT and not in ETF format.
The Edit menu
![]() in the icon bar on top of the main window. To paste the object(s) elsewhere on the drawing sheet or onto another drawing sheet, click once at the location on the sheet where the new object has to go and issue the Edit>Paste command from the menu, type "Ctrl V" on the keyboard or click the paste icon
in the icon bar on top of the main window. To paste the object(s) elsewhere on the drawing sheet or onto another drawing sheet, click once at the location on the sheet where the new object has to go and issue the Edit>Paste command from the menu, type "Ctrl V" on the keyboard or click the paste icon![]() in the icon bar. If the copied object is an undissociated graph, the coordinates of the data points may be pasted onto a spreadsheet as well. In the latter case, links between the spreadsheet columns and the data in the graph are established, such that a modification in the spreadsheet column will cause the graph to be redrawn with the new modified data.
in the icon bar. If the copied object is an undissociated graph, the coordinates of the data points may be pasted onto a spreadsheet as well. In the latter case, links between the spreadsheet columns and the data in the graph are established, such that a modification in the spreadsheet column will cause the graph to be redrawn with the new modified data.
* To break the link with the spreadsheet, issue the Edit>Remove Link command from the menu. To delete objects, issue the Edit>Delete command from the menu, type "Ctrl X" on the keyboard or click the delete icon in the icon bar. The object has not disappeared altogether, as it has been copied to the clipboard. Hence it can still be pasted elsewhere. All objects on a drawing sheet can be selected by the Edit>select all menu item (Ctrl A). This item is especially useful if objects have become invisible, extremely small or have been moved outside of the drawing sheet.
* Multiple objects can be grouped into a single composite object by the Edit>Associate command or by typing <Ctrl> G on the keyboard. Edit>Dissociate or <Ctrl> D does the reverse, it dissociates a composite object into multiple objects. When dissociating a graph, it looses the possibility to have its axes or its data redefined and is reduced to a mere set of vectors. This dissociation of graph and the removal of its hidden data is irreversible.
Drawing objects can be made transparent. Set the transparency (in %) either by moving the slider or by filling in the edit box![]() in the dialogue box that appears.
in the dialogue box that appears.
Resets the size of the graph to its original dimensions.
This menu item creates skeleton legend(s) to the currently selected histogram(s). The legend text may then be edited using the text tool ![]() .
.
Remove the link that may exist between the selected graph and columns on a spreadsheet.
Clicking on an object when in web mode results in loading a page or file that the hyperlink, associated with the object, is pointing to. The hyperlink may be an html page on the internet (e.g. http://bram.org) or a file on the hard disk (e.g. C:/a-folder/some-file.his). Per default objects have no hyperlink. A link can be associated with an object using this menu item. When in web mode, objects cannot be selected and most object manipulation menu-items are inactive (greyed). To enter web mode toggle the Tools>web mode option.
This item toggles the object select/displacement mode. In the default, non-quick move mode, one has to select the object(s) with the mouse and click a second time on (one of) the selected object(s) to start moving the object(s) around. In the quick move mode, it is not necessary to select the object before moving it. It suffices to click on the object and while holding down the left mouse button move the mouse. To move multiple objects at the same time in this mode, keep the <Shift> key depressed while selecting and moving. The latter mode may be more rapid, it is also less sure, since it is not known beforehand with certainty which object will be displaced if the drawing sheet contains many objects.
* When exporting an object as vectors (WMF) to another program, a polygon such as a curve in a graph can be exported as a single object or as a series of line segments (multiple objects). Some programs find it difficult to dissociate a polygon into line segments. If that is the case, choose the "multiple objects" option. Set your choice using the Edit>Copy preferences menu item.
* The Edit>Save prefs menu item saves parameter settings to disk.
These settings are:
The window size,
The character font,
The pen size,
The page size, e.g. A4, US letter,
The page orientation, i.e. portrait or landscape,
Whether or not to adapt text size when sizing objects,
Outline and fill colours,
The way to align objects,
The way to draw underlying layers.
These settings will then apply to newly created drawing windows.
The Window menu
![]() wherein the desired layer number (any positive number below 1 billion) should be typed. The dialogue box also shows a list of layers currently containing drawing objects. Hence, Window>Go to layer>other may be used as well to get the list of occupied layers if one has lost track of the number of layers in use. After the new layer has been selected, the current layer index is shown at the right on the window status bar (i.e. the lower boundary of the application window). A second benefit of the layer approach is the possibility to eliminate from view or grey-out the objects of other layers while working with the current layer. To do so, select Draw lower layers>draw not or Draw lower layers>draw soft(er) from the Window menu. The first option eliminates objects not belonging to the current layer from view, while the second draws them with colours that are intermediate between the object colour and the background colour. Draw soft(er) should be used with caution if the layers contain many bitmaps, since it takes processor time to grey-out bitmaps and may therefore reduce overall performance.
Although the goal of the layer approach is to prevent selection of objects other than those belonging to the current layer, the need may be sometimes felt to select them anyway. This can be done by maintaining the <Ctrl> key depressed while clicking on objects. Note that most functions, such as the cut tool
wherein the desired layer number (any positive number below 1 billion) should be typed. The dialogue box also shows a list of layers currently containing drawing objects. Hence, Window>Go to layer>other may be used as well to get the list of occupied layers if one has lost track of the number of layers in use. After the new layer has been selected, the current layer index is shown at the right on the window status bar (i.e. the lower boundary of the application window). A second benefit of the layer approach is the possibility to eliminate from view or grey-out the objects of other layers while working with the current layer. To do so, select Draw lower layers>draw not or Draw lower layers>draw soft(er) from the Window menu. The first option eliminates objects not belonging to the current layer from view, while the second draws them with colours that are intermediate between the object colour and the background colour. Draw soft(er) should be used with caution if the layers contain many bitmaps, since it takes processor time to grey-out bitmaps and may therefore reduce overall performance.
Although the goal of the layer approach is to prevent selection of objects other than those belonging to the current layer, the need may be sometimes felt to select them anyway. This can be done by maintaining the <Ctrl> key depressed while clicking on objects. Note that most functions, such as the cut tool ![]() , will also work on objects on other layers if the <Ctrl> key is held down.
, will also work on objects on other layers if the <Ctrl> key is held down.
Curve properties
![]() and the "line colour" push button define the thickness of the line connecting the data points and allow you to select the line colour respectively. In the latter case, a second dialogue window, displaying the palette associated with the current drawing window, pops up. The current line colour is highlighted by a white square. If you click in one of the little squares, the colour changes and the dialogue window disappears. The first little box in the palette (index=0) is transparent.
and the "line colour" push button define the thickness of the line connecting the data points and allow you to select the line colour respectively. In the latter case, a second dialogue window, displaying the palette associated with the current drawing window, pops up. The current line colour is highlighted by a white square. If you click in one of the little squares, the colour changes and the dialogue window disappears. The first little box in the palette (index=0) is transparent.
The "symbol" panel groups a number of options that define form, size and colour of the symbol representing each data point in the currently selected curve. Note that if the "connect points with line" checkbox is unchecked and symbol is "none", the curve disappears completely. The associated data however, remain available. If the "bars" option is selected, serf draws a bar between the data point and the x-axis of the graph. This option is used for example when drawing dwell time histograms or probability-density distributions. The "symbol size" has no effect when in "bar mode". If the currently selected curve has error data associated with it, then error bar drawing may be switched on or off by selecting the appropriate checkboxes in the upper right panel of the dialogue window.

![]()
1) Before starting to fit, push the "Function" button to select a fitting function. A second dialogue window will pop up, displaying several fit options and fit functions.
2) Push the "Do Fit" button to start fitting. After fitting, the same window pops up again, now showing the fitted parameters and the error of fit.
3) To remove a fitted curve, push the "Remove" button.
Two vertical red lines are drawn in the graph on the drawing sheet. These two lines delimit the x-range of data points that will be used to obtain the fit. The slide bar![]() s marked "fit range from" and "to" control the positions of the two red lines. The "line width" slide bar
s marked "fit range from" and "to" control the positions of the two red lines. The "line width" slide bar![]() and the "line colour" push button determine width and colour of the fitted function trace. The fitting functions to data chapter supplies additional information.
and the "line colour" push button determine width and colour of the fitted function trace. The fitting functions to data chapter supplies additional information.
The lower left corner of the dialogue window indicates whether the graph data are linked with columns of data on a spreadsheet and if so, to which spreadsheet and which columns.
![]() The curve properties window contains a checkbox "confidence limits". If this box is checked, lines appear above and below the fitted function depicting the 95% confidence band. This means that there is a 95% probability that the true Y value for a given X resides within this band.
The curve properties window contains a checkbox "confidence limits". If this box is checked, lines appear above and below the fitted function depicting the 95% confidence band. This means that there is a 95% probability that the true Y value for a given X resides within this band.
A dialogue window pops up after having double-clicked on one of the error bars in a graph. Use the upper slide bar![]() to change the error bar width and the slide bar
to change the error bar width and the slide bar![]() below it to change the pen width. The pen colour can be changed by pushing the "pen colour" button. A second dialogue window will then pop up containing 256 little coloured squares. Click on the one with the colour of your choice. The error bars depict ±SEM. To show only the upper half (+SEM) or lower half (-SEM), (un)check the appropriate check boxes
below it to change the pen width. The pen colour can be changed by pushing the "pen colour" button. A second dialogue window will then pop up containing 256 little coloured squares. Click on the one with the colour of your choice. The error bars depict ±SEM. To show only the upper half (+SEM) or lower half (-SEM), (un)check the appropriate check boxes![]() . If the graph contains many data points, the error bars may clutter the graph. In that case, the confidence limits may be depicted by a line that runs parallel to the data points (option: draw as a line).
. If the graph contains many data points, the error bars may clutter the graph. In that case, the confidence limits may be depicted by a line that runs parallel to the data points (option: draw as a line).
How to modify the axes of a graph
![]() "From" and "To". The distance between major and minor ticks can be set by editing the "Major tick every" and "Minor tick every" boxes. Note that if "scale type" is set to "log", the "Major tick" edit box
"From" and "To". The distance between major and minor ticks can be set by editing the "Major tick every" and "Minor tick every" boxes. Note that if "scale type" is set to "log", the "Major tick" edit box![]() is labelled "Major tick log". This edit box then shows log-base 10 as default, but this may be changed to any other base as long as it is larger than zero. The place where the Y axis crosses the X axis can be set in the "Y axis crosses at" edit box. If the value entered here is lower than in the "From" box or larger than in the "To" box, the axes will not intersect in the graph.
is labelled "Major tick log". This edit box then shows log-base 10 as default, but this may be changed to any other base as long as it is larger than zero. The place where the Y axis crosses the X axis can be set in the "Y axis crosses at" edit box. If the value entered here is lower than in the "From" box or larger than in the "To" box, the axes will not intersect in the graph.
The orientation of ticks and scale type is set by selecting the appropriate ![]() radio button.
radio button.
A grid can be laid over the graph by checking ![]() vertical grid and/or
vertical grid and/or ![]() horizontal grid. The grid lines associated with the minor ticks will be dotted if the
horizontal grid. The grid lines associated with the minor ticks will be dotted if the ![]() minor grid dotted box is checked.
Per default, axes are drawn with ticks having numbers alongside. If
minor grid dotted box is checked.
Per default, axes are drawn with ticks having numbers alongside. If ![]() X or Y calibration bar is checked, a horizontal or vertical calibration bar is drawn in stead with a size equal to the value entered in the "Bar size" edit box
X or Y calibration bar is checked, a horizontal or vertical calibration bar is drawn in stead with a size equal to the value entered in the "Bar size" edit box![]() . The position of the calibration bar is determined by the values entered in the "Bars(s) at" edit boxes. Some options, like the latter one, are not available for the wind rose plot.
. The position of the calibration bar is determined by the values entered in the "Bars(s) at" edit boxes. Some options, like the latter one, are not available for the wind rose plot.
The units of the axes or any other text that accompanies an axis can be entered in the lower-most edit box![]() .
.
Each time a graph the user sizes a graph, the text size changes too. This behaviour can be switched off by checking ![]() Fixed text size.
Fixed text size.
If a new graph was created from spreadsheet columns, where the column furnishing the X data is entirely in timeThe time format is of the form "hh:mm:ss" where hh is the number of hours, mm minutes and ss the number of seconds. example: 10:32:59 or dateThe date format is of the form "dd/mm/yyyy" where dd is days (1-31), mm the month of the year (1-12) and yyyy the year according to the Gregorian calendar. Example: 12/10/2016. format, then the X-axis labels will be in time or date format too. Note that wind rose plots cannot have coordinates in time or date format. Double clicking on one of the axes in the graph will activate the Axes dialogue box as usual. Note however that the x-coordinates are now in time or date format. If the user enters a floating point number (rather than a time or a date) in one of the X-axis edit box![]() es, then a new dialogue box will pop up upon exit of the Axes dialogue box. In this box the user indicates if the graph should remain in time/date format or should be converted to floating point (seconds/days). To convert the X-axis from floating point (seconds/days) to time/date format do similarly (hence type at least one entry in time or date format).
es, then a new dialogue box will pop up upon exit of the Axes dialogue box. In this box the user indicates if the graph should remain in time/date format or should be converted to floating point (seconds/days). To convert the X-axis from floating point (seconds/days) to time/date format do similarly (hence type at least one entry in time or date format).
If the graph's X-axis is in date format, the Axes dialogue box is slightly different from the usual one in that the major and minor tick size should be entered in multiples of years (y), months (m) or days (d). Since the length of years and months is not constant (leap years, February is shorter than December) this results in non-equidistant ticks in the graph.
How to change the colour palette
The program uses 8 bit indexed colour objects to display the contents of a drawing sheet. Each drawing sheet has its own dedicated palette. You may change drawing object colours by clicking the ![]() or the
or the ![]() buttons in the drawing tool window or by selecting the menu items Tools>Outline colour or Tools>Fill colour. Whereas the drawing tool buttons only allow you to pick a colour, the menu items also allow you to modify the palette itself. After having selected one of the two menu items, a dialogue window pops up displaying the current palette. To save or load a palette, push the "save" or "load" buttons. A second window comes up requesting a "*.mpl" file name. Do not change the "*.mpl" extension. To revert to the program-defined default palette, push "default". To change the RGB (red, green, blue) values of one of the palette entries, click on a little coloured box in the palette. The selected box is highlighted by a white square around it and the box marked "old" now displays the selected colour along with its index number. Next move the Red, Green and Blue slide bars to change the colour. The new colour appears in the "new" box. To enter the new colour in the palette, push the "OK" button. To copy the colour from one index to another, carry out the following sequence:
buttons in the drawing tool window or by selecting the menu items Tools>Outline colour or Tools>Fill colour. Whereas the drawing tool buttons only allow you to pick a colour, the menu items also allow you to modify the palette itself. After having selected one of the two menu items, a dialogue window pops up displaying the current palette. To save or load a palette, push the "save" or "load" buttons. A second window comes up requesting a "*.mpl" file name. Do not change the "*.mpl" extension. To revert to the program-defined default palette, push "default". To change the RGB (red, green, blue) values of one of the palette entries, click on a little coloured box in the palette. The selected box is highlighted by a white square around it and the box marked "old" now displays the selected colour along with its index number. Next move the Red, Green and Blue slide bars to change the colour. The new colour appears in the "new" box. To enter the new colour in the palette, push the "OK" button. To copy the colour from one index to another, carry out the following sequence:
1) Click the little box to be copied,
2) push the "from" button,
3) click the little box to copy to,
4) push the "to" button and finally
5) push the "Copy" button.
To create a gradient of colours carry out the following sequence:
1) Click the little box that contains the starting colour,
2) push the "from" button,
3) click the little box where you wish to end the gradient,
4) push the "to" button and finally
5) push the "Spread" button.
Push the "Done" button when you're done editing. An alternative way to modify the palette is to extract it from a bitmap on the sheet. When issuing the Tools>Get palette from bitmap command, a new palette will be calculated based on the colours present in the bitmap. Note that the first three colours of the palette remain unchanged, since they have a special meaning for the sheet: transparent, background colour and pen colour.